
Yves here. And one wonders why Trump’s popularity ratings continue to plunge? He’s openly expressed a lack of concern about the impact of the war on household budgets. His officials and media allies have acted as if consumers should be willing to suffer what they pretend is the short-term pain of (supposedly only) higher gas prices for the greater good of busting up Iran, yessiree. As Wolf Richter demonstrates, inflation now extends well beyond energy prices.
By Wolf Richter, editor at Wolf Street. Originally published at Wolf Street
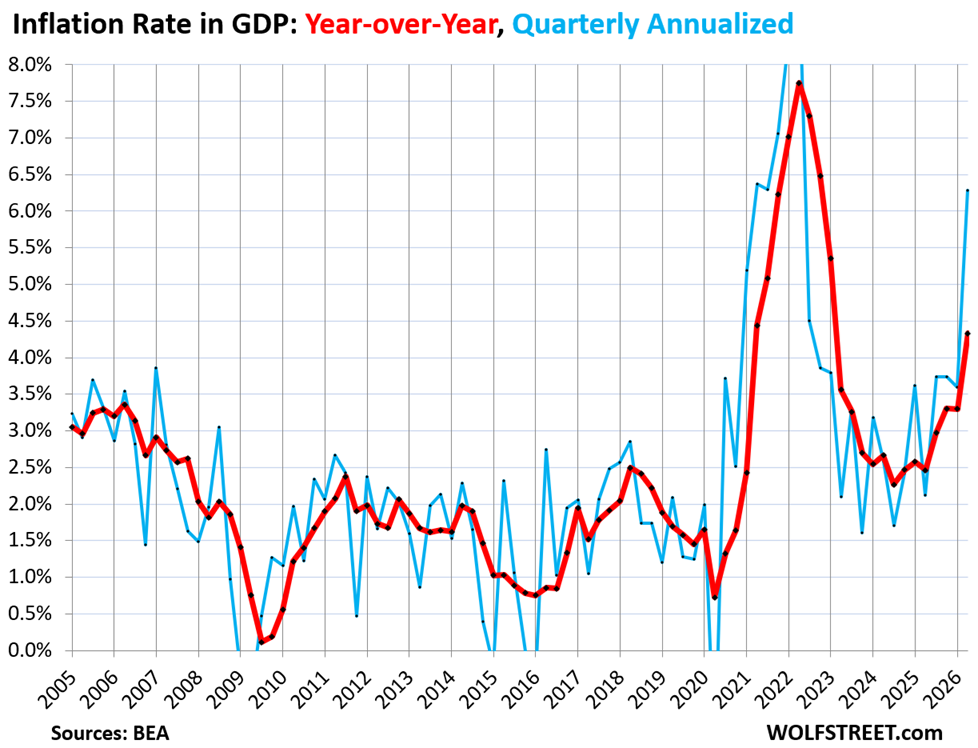
As part of its huge data release today, the Bureau of Economic Analysis also released the quarterly inflation data across the GDP accounts. These are price changes in all goods and services that all participants in the US economy purchase: consumers, businesses, and governments. These inflation rates are far broader than the consumer-price inflation rates of CPI and the PCE price index. All GDP data are quarterly, which irons out some of the wild month-to-month squiggles of monthly data. And in inflation in Q2 was really bad – even when excluding energy.
Overall inflation in GDP (“GDP deflator”), which tracks inflation in the entire economy, soared by 6.3% in Q2 from Q1 annualized, the worst since Q2 2022 (blue line in the chart below).
Year-over-year, GDP inflation jumped by 4.3%, the worst since Q1 2023 (red line). So sure, energy prices spiked in Q2, though they starting falling halfway through Q2. But wait… the core measure of inflation in GDP, which excludes energy and food, also spiked by the most since Q2 2023. More in a moment.

Without energy and without food, inflation in GDP jumped by 4.4% in Q2 from Q1 annualized, the worst since Q1 2023 (blue line in the chart below).
Year-over-year, GDP inflation without energy and food, jumped by 3.8%, the worst since Q2 2023 (red in the chart below).

Both of these measures – overall inflation in GDP and core inflation in GDP – show red-hot inflation across the US economy for all participants in the economy. And on a year-over-year basis, these inflation rates have been accelerating sharply for four quarters in a row. This isn’t just a new thing that happened with the war in Iran.
The Fed doesn’t use these overall measures of inflation in the US economy as yardstick for its inflation target of 2%. It uses the PCE price index, which is a measure of consumer price inflation. But the quarterly PCE price index, also released today by the Bureau of Economic Analysis, shows a similar trajectory and level.
The consumer-oriented quarterly PCE price index jumped by 5.1% annualized in Q2 from Q1, the second worst increase since Q1 2022, according to BEA data today. This is a subset of the GDP inflation data above, focusing on prices of goods and services that consumers pay.
Year-over-year, the quarterly PCE price index jumped by 3.8%, the worst since Q2 2023.
So energy was one of the drivers, though energy prices were already dropping in the second portion of Q2. But energy wasn’t the only driver – see the “core” PCE price index which excludes energy. And the year-over-year acceleration further way from the Fed’s 2% target started a year ago.

The quarterly “core” PCE price index, which excludes energy and food, rose by 3.4% annualized in Q2, the second worst quarter-to-quarter increase since Q1 2024, the worst increase having been the prior quarter.
Year-over-year, the quarterly “core” PCE price index jumped by 3.3%, the worst increase since Q2 2023.

This is quarterly consumer price inflation, and it’s really bad, even without energy. But businesses and governments face even higher inflation rates, and so the overall inflation rates for the US economy are currently higher – see the top two charts – than consumer inflation rates.
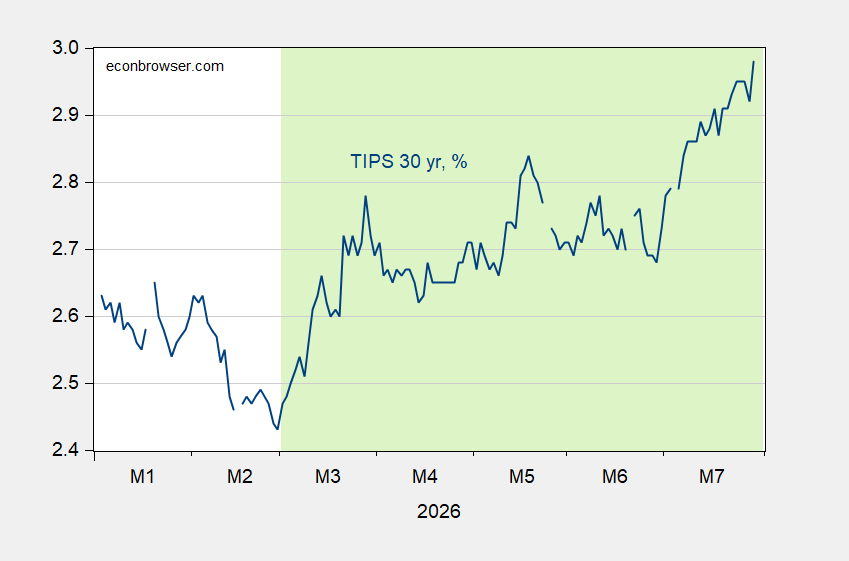
The FOMC members need to stop playing games and coalesce into a big majority to crack down on this situation, lest the bond market figures out what is going on in here… Oops, highest 30-year Treasury yield since 2007.


 By
By