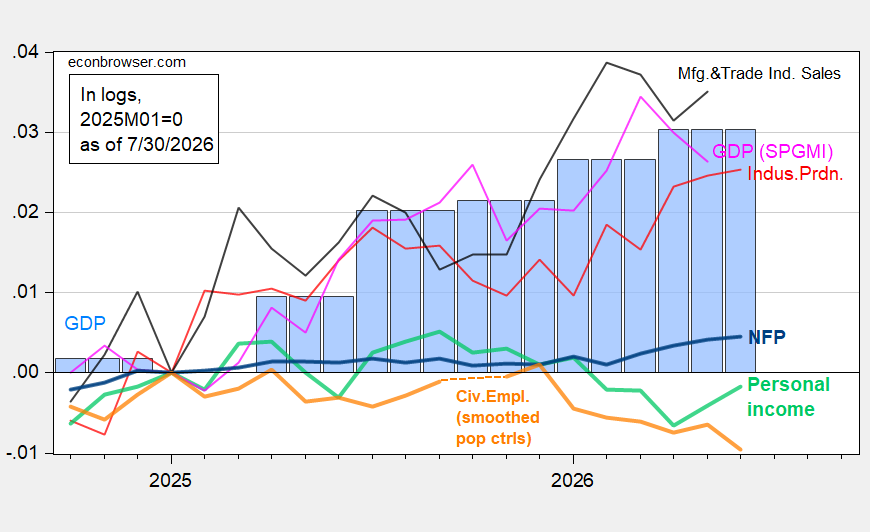
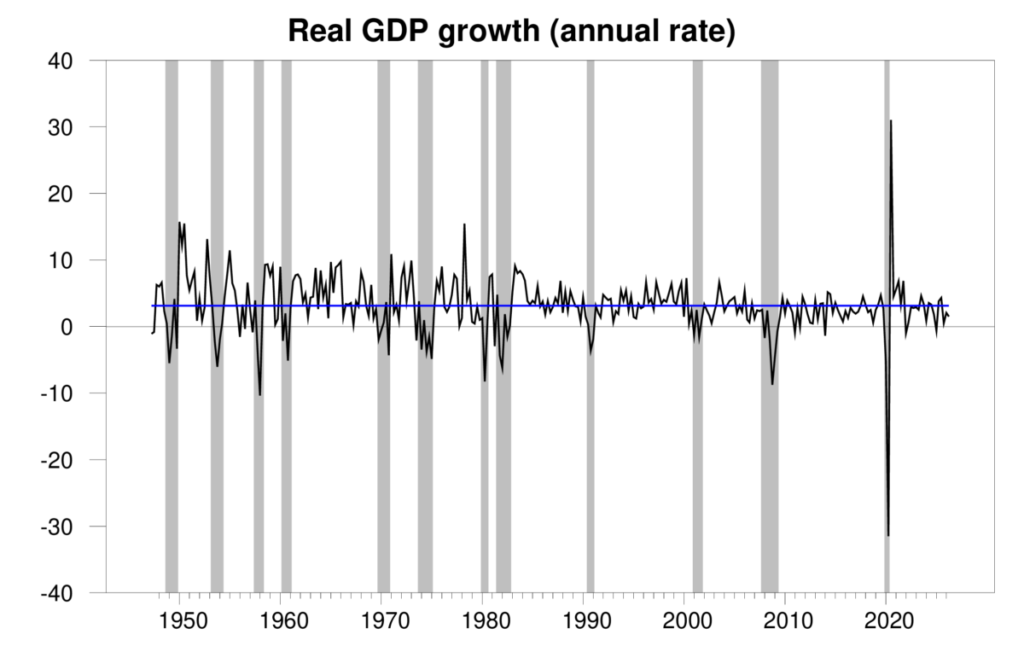

The Bureau of Economic Analysis announced today that seasonally adjusted U.S. real GDP grew at a 1.5% annual rate in the second quarter. That is about half of the historical average growth of 3.1% and continues a record of slow growth over the last three quarters.
Quarterly real GDP growth at an annual rate, 1947:Q2-2026:Q2, with the historical average since 1947 (3.1%) in blue. Calculated as 400 times the difference in the natural log of real GDP from the previous quarter.
The new numbers put the Econbrowser recession indicator index at 7.0%, about where it was last quarter.
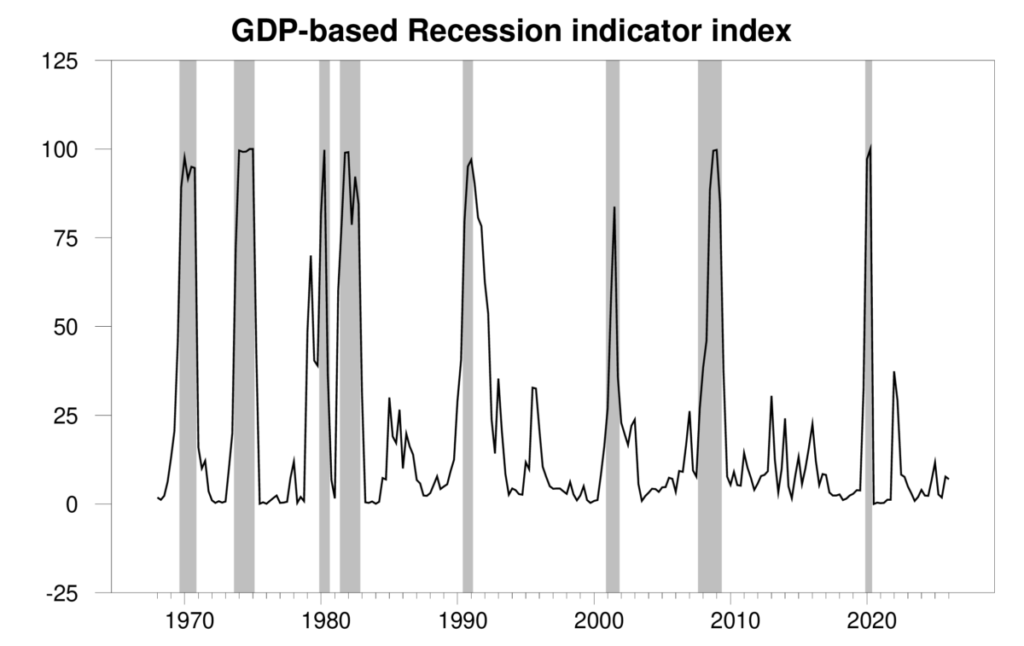
GDP-based recession indicator index. The plotted value for each date is based solely on the GDP numbers that were publicly available as of one quarter after the indicated date, with 2026:Q1 the last date shown on the graph. Shaded regions represent the NBER’s dates for recessions, which dates were not used in any way in constructing the index.
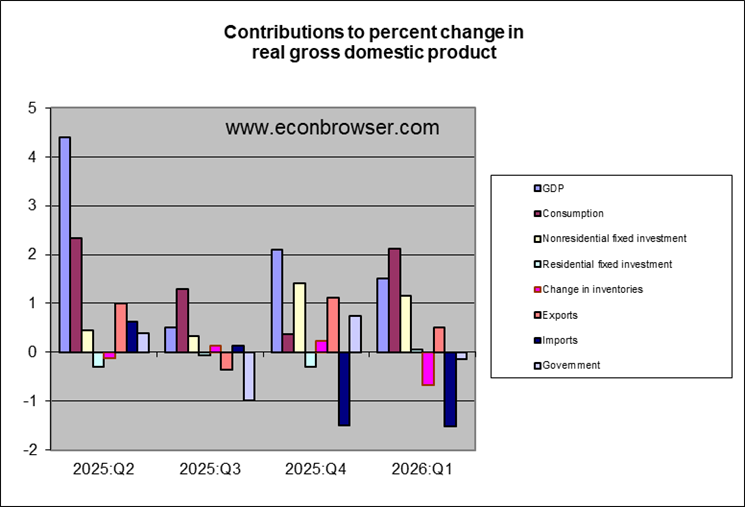
Some patterns from the previous quarter were repeated. Nonresidential fixed investment, in part propelled by spending for AI infrastructure, contributed significantly to the Q2 growth. But many of these components were imported, so the net contribution to U.S. GDP — which measures production of new goods in the United States — was more muted. Consumption spending was strong, with some sales being met by inventory drawdown.
I continue to be concerned about events in the Strait of Hormuz, and confess to being a little mystified by the big daily jumps up and down in oil prices in response to rumors of a settlement. I see conflict in the Middle East as an ongoing unfavorable factor for U.S. real GDP growth and inflation.

 By
By