Given positive Q1 GDP growth (albeit with downside surprise of 0.3% vs 0.5% q/q Bloomberg consensus, vs. 0.4% Melbourne Institute nowcast), there’s been a substantial amount of commentary regarding elevated recession risks [1] [2]. I find this surprising as the IMF’s April WEO projected 2% y/y growth for 2026 — of course conditional on a baseline that assumed eventually decreasing oil prices. On June 3, OECD projected 1.9%, while the latest Economist Intelligence Unit forecast is 1.6%. Eyeballing the RBA forecast as of June 2, it seems like their forecast is about 1.3%, still not negative growth.
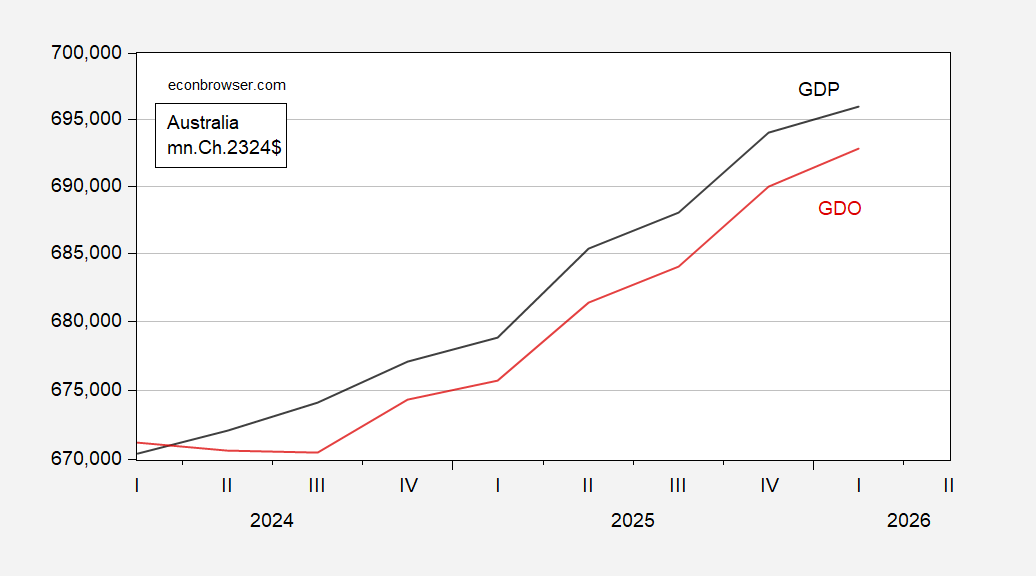
First, consider GDP:

Figure 1: GDP (blue), average of GDP and GDI (red), all in mn.Ch.2024-25$, s.a., on a log scale. GDI from RBA. Source: ABS, RBA, and author’s calculations.
GDP grew 0.3% q/q in Q1, down from 0.9% in Q4. GDI grew faster, so what we would call GDO in the US exhibits 0.4% q/q growth; no special importance seems to be accorded this variable in Australia, though.
Second, consider aggregate demand proxies, as well as personal income.
In the US, “core GDP” has been the variable of focus, given the vagaries of measurement induced by trade policy. That variable accelerates into Q1.
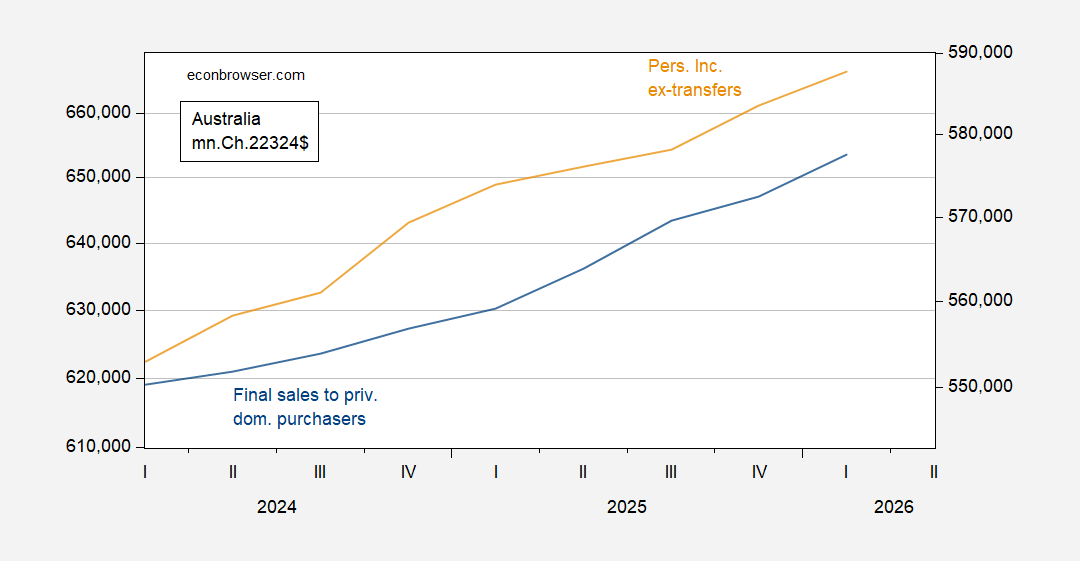
Figure 2: Final sales to private domestic purchasers (blue, left log scale), and personal income ex-transfers (tan, right log scale), both in mn.Ch.2023-24$, s.a. Source: ABS and author’s calculations.
For a relatively open economy like Australia, domestic final sales doesn’t seem particularly relevant. Perhaps more important for assessing momentum is final sales ex-government and public sector investment; growth decelerates from 0.6% to 0.2%, reflecting lower exports and higher imports. To the extent that key export destinations are in East Asia, their oil-shortage induced slowdown will impact Australia’s exports going forward. On the other hand, personal income derived from economic activity continued to grow into Q1.
Third, there’s employment. This is the only key indicator we have pertaining to Q2. In April employment declined from March, as the unemployment rate increased by 0.2 percentage points.
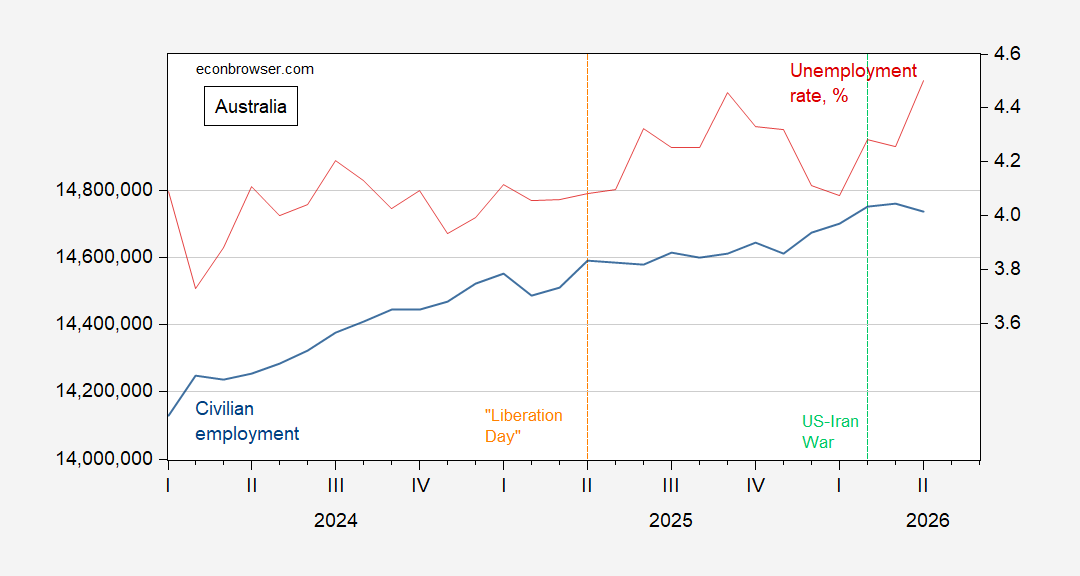
Figure 3: Australian civilian employment (blue, log scale), unemployment rate, % (red, right scale), s.a. Source: ABS.
Returning to the forecasts, it’s important to remember that each one is conditional upon some view about the evolution of oil prices, and hence the chances for reopening the Strait of Hormuz in a substantial way. As of today, the prediction market Kalshi put the probability of reopening by September 1st at 33%, an all time low for that bet.
 By
By