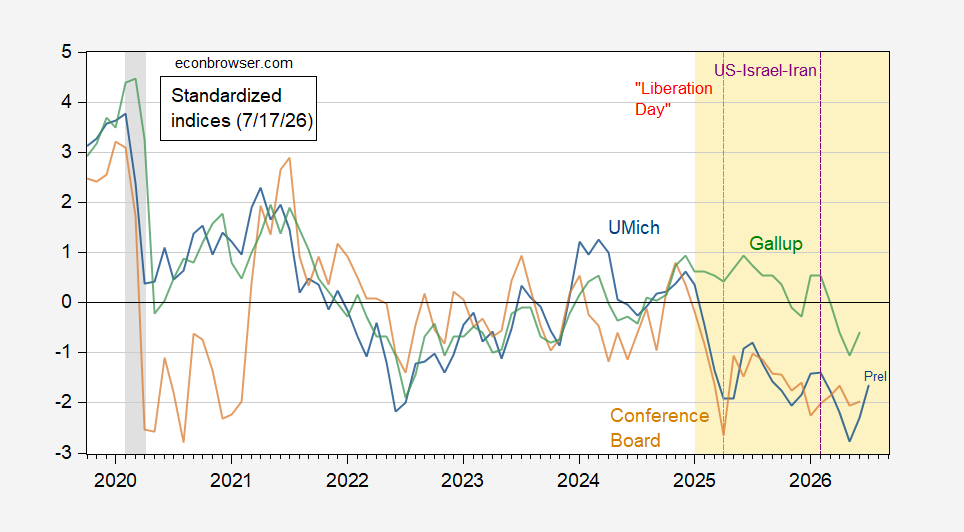

Continued rebound for sample June 23 to July 13 — which largely predates the resumed increase in gasoline prices.
Figure 1: U.Michigan Economic Sentiment (blue), Conference Board Confidence Index (brown), Gallup Confidence (green), all demeaned and divided by standard deviation 2021M01-2025m02. Orange dashed line at “Liberation Day”, green dashed line at US-Iran War start. Source: UMichigan, Gallup, Conference Board, and author’s calculations.
Hsu discusses web bias in the Michigan survey.
Inflation expectations were also reported.
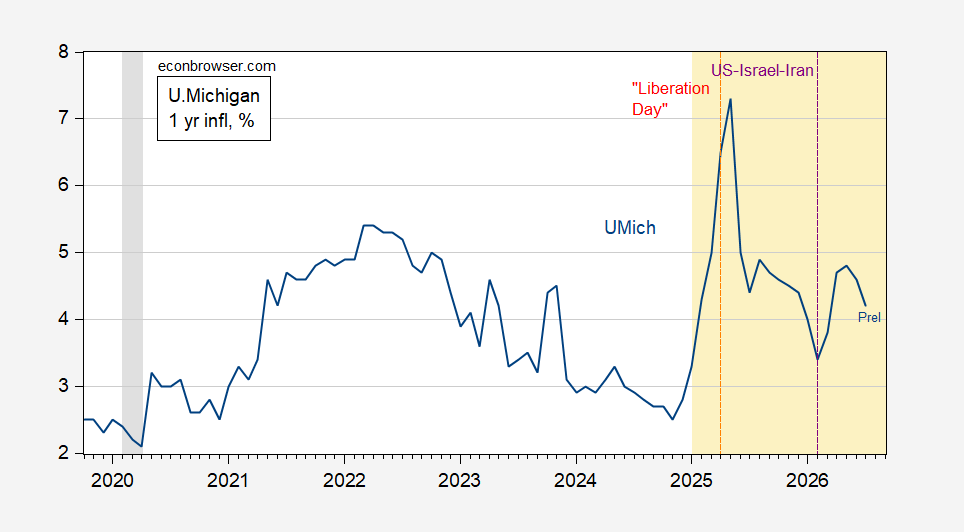
Figure 2: U.Michigan Economic one year expected CPI inflation (blue), Orange dashed line at “Liberation Day”, green dashed line at US-Iran War start. Source: UMichigan.
Note that the July readings cover survey responses 6/23-7/13, when gas prices were (relatively) low:
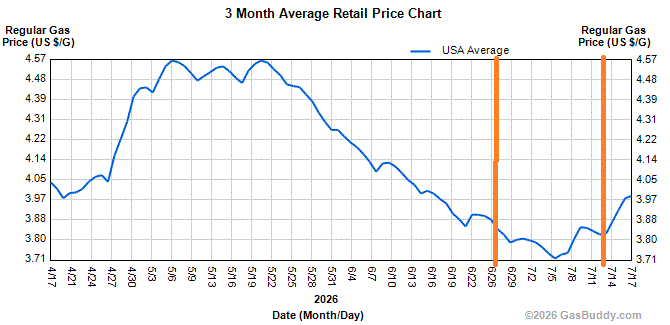
I suspect that the July final reading will read lower for sentiment, higher for inflation expectations.

 By
By