QCEW covered employment data through end-2025 is out.
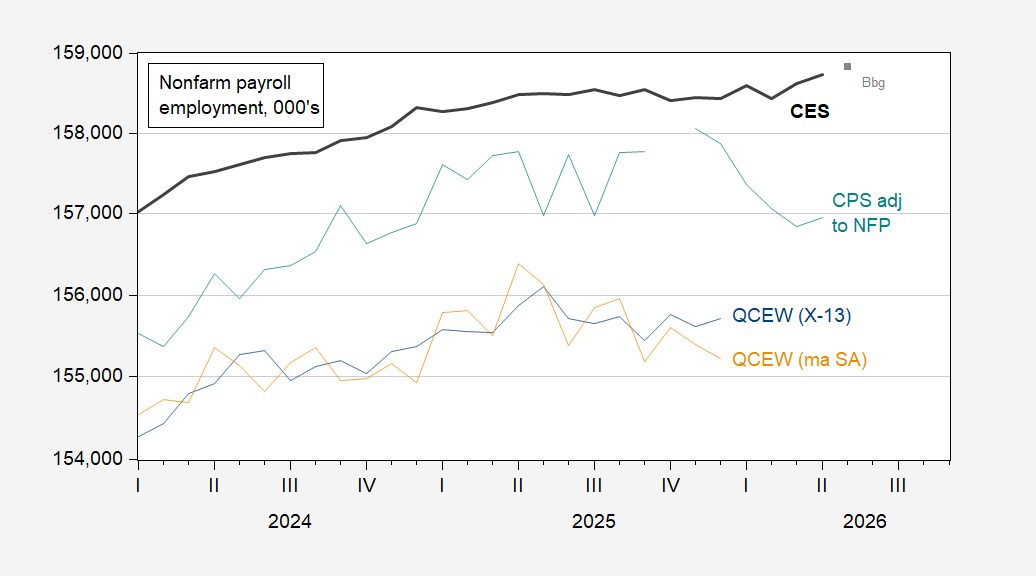
Figure 1: Nonfarm payroll employment from BLS CES (bold black), Bloomberg consensus of 6/2 (gray square), QCEW seasonally adjusted by author using X-13 (blue), using multiplicative moving average (brown), BLS CPS series adjusted to NFP concept (green), all in 000’s. Source: BLS via FRED, BLS, and author’s calculations.
Seasonally adjusted QCEW data confirms the official BLS data indicating flat employment through 2025, although it is suggestive that end-year employment seasonally adjusted indicates employment is below peak in March-April.
The CPS (household survey) series is a series I tend to put less focus on, given its higher volatility. Furthermore, it is dependent on population controls that change with the new year, which makes interpretation of peaks at year’s start (as in the overall civilian employment series) problematic. However, in this case, the apparent peak is November 2025, so we can see a decline in December, which has continued through April.
Figure 2 focuses on official NFP from CES vs. seasonally adjusted QCEW.
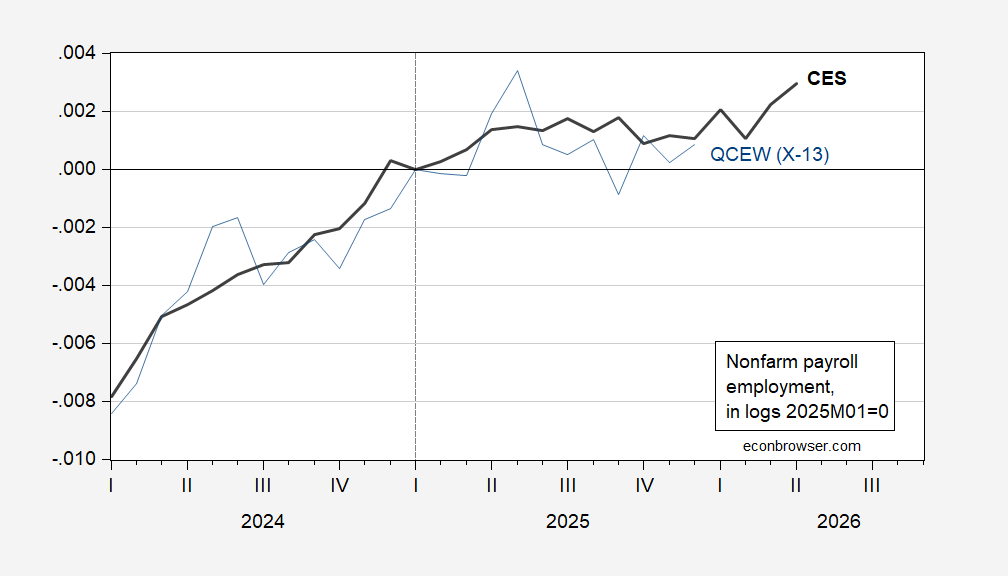
Figure 2: Nonfarm payroll employment from BLS CES (bold black), QCEW seasonally adjusted by author using X-13 (blue), both in logs 2025M01=0. Source: BLS via FRED, BLS, and author’s calculations.
Come August, the preliminary benchmark revision will incorporate this QCEW data.
 By
By