• Home
  • Economy
  • Grocery Prices (and Forecasts) | Econbrowser
Image

Grocery Prices (and Forecasts) | Econbrowser


As of the April 2026 CPI release:
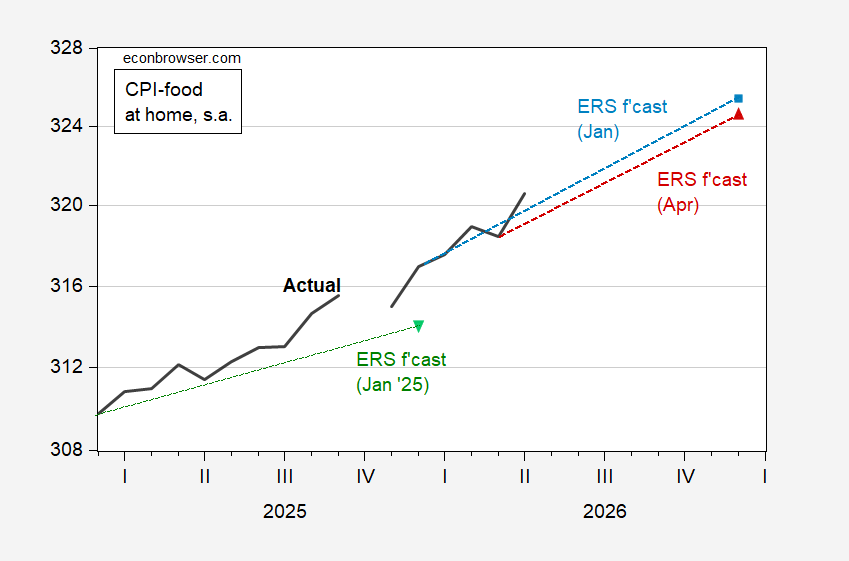
Figure 1: CPI – food at home (black), January 2025 ERS forecast (inverted green triangle), January 2026 forecast (light blue square), April 2026 forecast (red triangle), all on log scale. Source: BLS, ERS, and author’s calculations.

Note that 2025 groceries inflation outstripped the January 2025 forecast, with the price index ending up 0.9 ppts higher than originally forecasted.

Some individual commodities since January 2025.
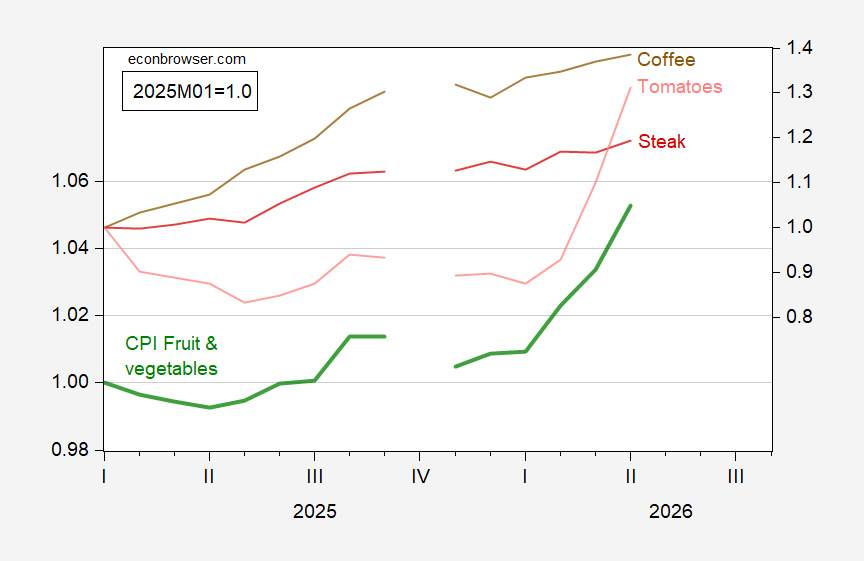
Figure 2: CPI – fruit and vegetables (green, left log scale), coffee (brown, right log scale), steak (red, right log scale), tomatoes (pink, log right scale), all 2025M01=1.0, on log scale). Source: BLS via FRED, and author’s calculations.

This entry was posted on by Menzie Chinn.


Source link

Releated Posts

Will the Trump Admin Buy Into OpenAI & Save Softbank?

Earlier this month OpenAI CEO Sam Altman suggested that the US government take a 5% ownership stake in…

ByByNews on SantoshHub Jul 14, 2026

Trapped at Home: Climate Stress Is More Likely to Immobilize the Poor Than to Move Them

Yves here. Perhaps readers will beg to differ, but I found this study to be maddening. It makes…

ByByNews on SantoshHub Jul 13, 2026

The Case of the (France-Sized) Missing Antarctic Ice

Conor here: Suppose the size of the missing ice is fitting considering the way France itself is baking…

ByByNews on SantoshHub Jul 13, 2026

Iran War: What Happens When the US Hits the Limits of Escalation Options?

[Today’s Iran war article launched before complete. Please return or refresh this page at 8:00 AM EDT for…

ByByNews on SantoshHub Jul 13, 2026

Leave a Reply

Your email address will not be published. Required fields are marked *

Scroll to Top