We’ve had a record low in the U.Michigan consumer sentiment in May (prel.). Given real aggregate output measures are rising smartly (see this post), why is sentiment so low? Has there been a structural break?
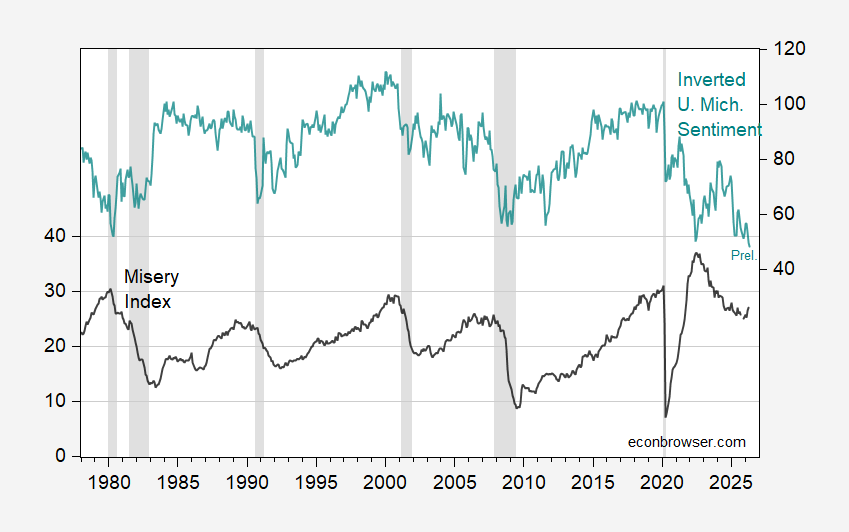
Figure 1: Misery index equals sum of unemployment and year-on-year inflation rate, % (black, left scale), inverted U.Michigan Consumer Sentiment index (teal, right scale). NBER defined peak-to-trough recession dates shaded gray. Source: BLS, U.Michigan via FRED, NBER, and author’s calculations.
A quick glance suggests a break starting in 2022, with the relationship between the inverted U.Michigan sentiment index parting ways with the Misery Index.
In order to test this formally, I estimated a linear regression between the U.Michigan index and unemployment and inflation entered separately; the adjusted R2 is 0.25. Using a one-step ahead forecast Chow test for a break, I obtain the following:
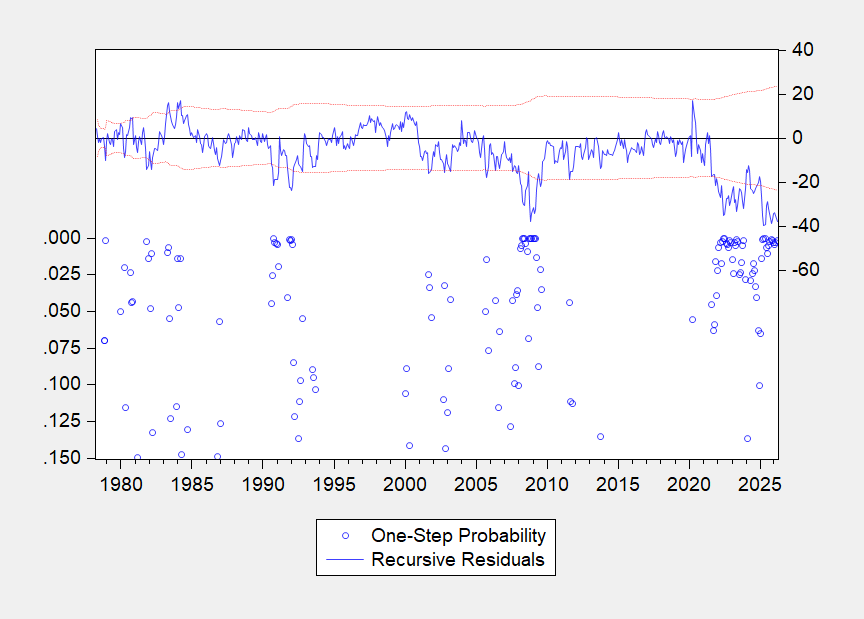
Figure 2: One step ahead forecast Chow test.
One could date one of the structural breaks to 2022, but in order to allow the data to speak, I’ve applied a battery of filters to the data: Hodrick-Prescott and Band-Pass (Baxter-King). In addition, I’ve detrended using unemployment and inflation over the entire 1978-2026 period, and a shorter 2022-2026 period. The results are shown in Figure 3, along with the raw U.Michigan sentiment index.
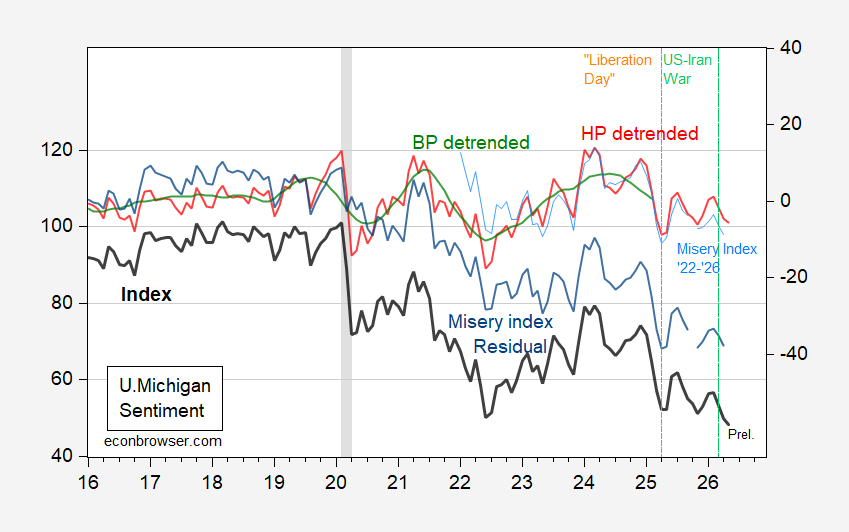
Figure 3: U.Michigan sentiment (bold black, left scale), HP detrended (red, right scale), Band Pass filter, two-sided (green, right scale), misery index regression residual (blue, right scale), and misery index regression 2022-26 residual (light blue, right scale). NBER defined peak-to-trough recession dates shaded gray. Source: U.Michigan via FRED, NBER and author’s calculations.
On the one hand, HP detrended sentiment does not look extraordinarily low in May. All this means is that there is a new statistical “trend” in sentiment. With a more economic perspective, the results clearly indicate that in recent years, sentiment has been lower than predicted by official unemployment and y/y inflation, from the “Misery index residual”. Truncating the sample period to 2022-26 (the elevated inflation period) results in a small residual.
The obvious question is what explains the disjuncture between unemployment and inflation on one hand, and sentiment on the other. Here we have an embarrassement of riches. It could be a heightened inflation sensitivity. For instance, the inflation coefficient doubled in value in the 2016-26 period. So, a heavier weighting on inflation after decades of low inflation is certainly plausible.
Heightened economic policy uncertainty is another possibility. Including the Baker-Bloom-Davis EPU doubles the adjusted R2 over the 1985-26 period, for instance. Much of the gap between predicted and actual sentiment then disappears. This result is shown in Figure 4.
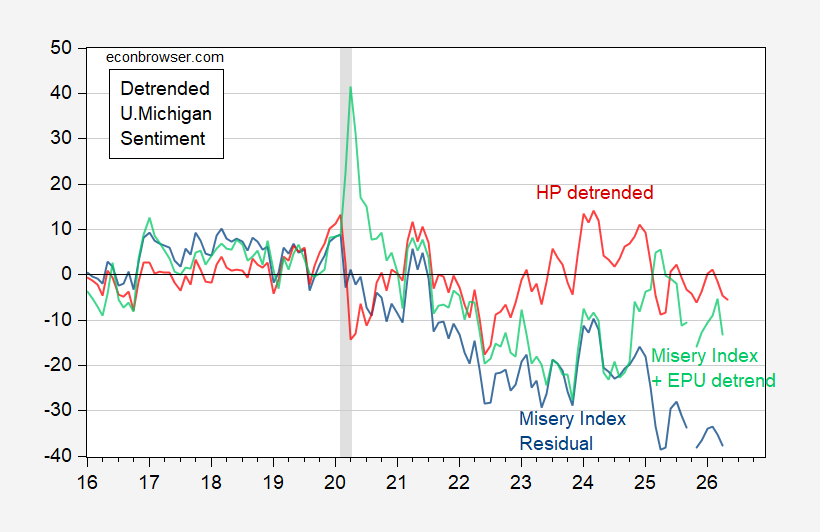
Figure 4: HP detrended sentimet (red), misery index regression residual (blue), and misery index plus EPU regression residual (light green). NBER defined peak-to-trough recession dates shaded gray. Source: U.Michigan via FRED, NBER and author’s calculations.
Another possibility is the fact that uemployment and inflation are unequally felt, more so than in the past, and this is being reflected in the breakdown in the historical correlations.
 By
By