• Home
  • Economy
  • Still Gloomy: Consumers in the Michigan Survey
Image

Still Gloomy: Consumers in the Michigan Survey


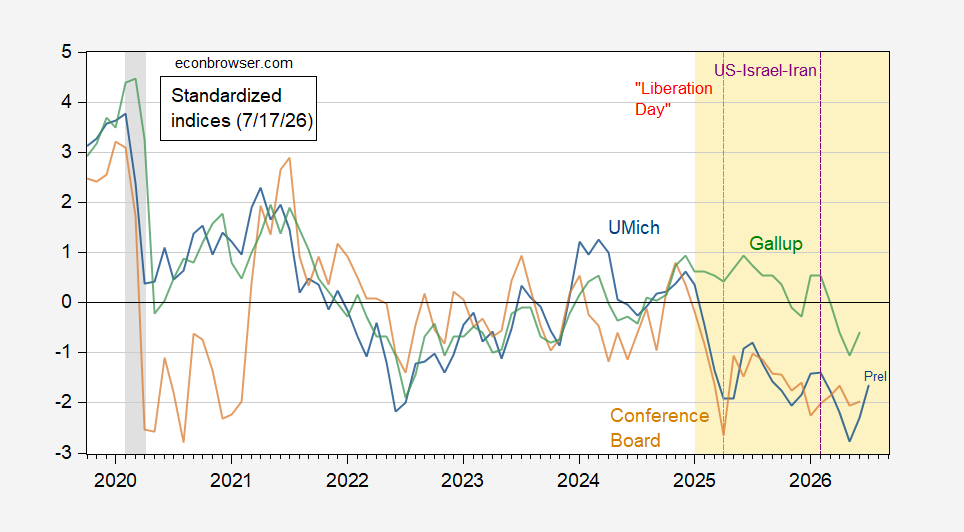
Continued rebound for sample June 23 to July 13 — which largely predates the resumed increase in gasoline prices.
Figure 1: U.Michigan Economic Sentiment (blue), Conference Board Confidence Index (brown), Gallup Confidence (green), all demeaned and divided by standard deviation 2021M01-2025m02. Orange dashed line at “Liberation Day”, green dashed line at US-Iran War start. Source: UMichigan, Gallup, Conference Board, and author’s calculations.

Hsu discusses web bias in the Michigan survey.

Inflation expectations were also reported.
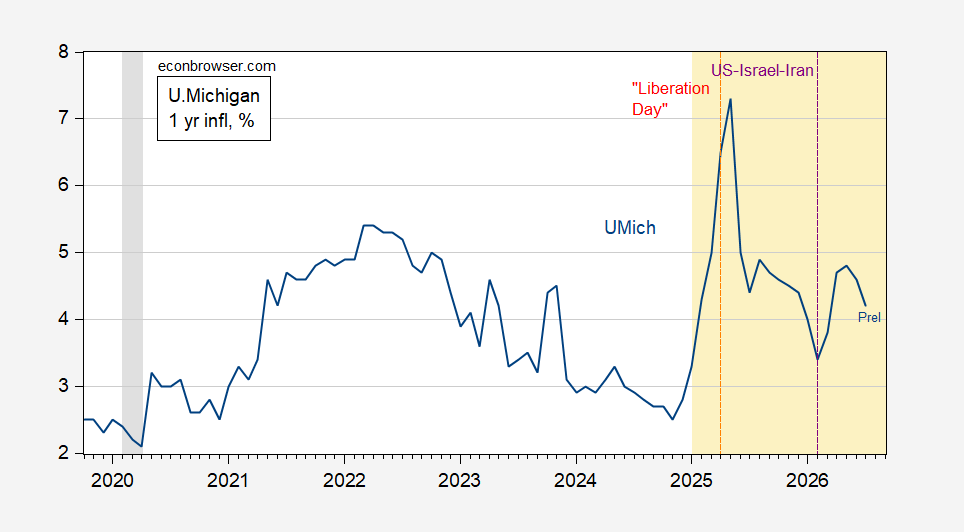
Figure 2: U.Michigan Economic one year expected CPI inflation (blue), Orange dashed line at “Liberation Day”, green dashed line at US-Iran War start. Source: UMichigan.

Note that the July readings cover survey responses 6/23-7/13, when gas prices were (relatively) low:
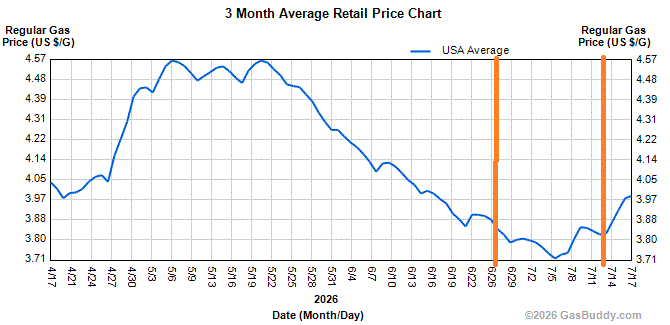
I suspect that the July final reading will read lower for sentiment, higher for inflation expectations.

This entry was posted on by Menzie Chinn.


Source link

Releated Posts

China Macro Indicators, As Reported

Catching up with the news overseas, China downside surprise: Goldman Sachs on the official statistics:  China’s real GDP…

ByByNews on SantoshHub Jul 18, 2026

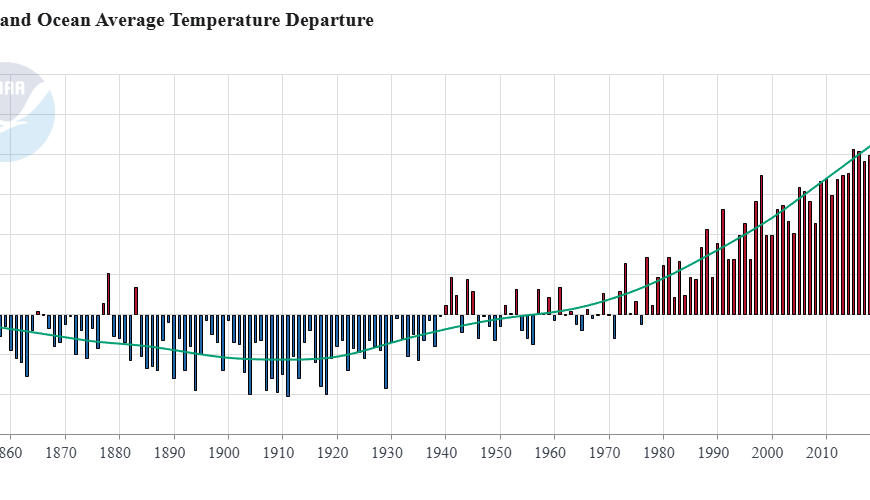
June Temperature Anomaly

For one month, trailing 12 months: Source link

ByByNews on SantoshHub Jul 18, 2026

Coffee Break: Health Care Digest

Part the First: Profit in Medicine.  In a report that will tug at the heartstrings of everyone, STAT…

ByByNews on SantoshHub Jul 18, 2026

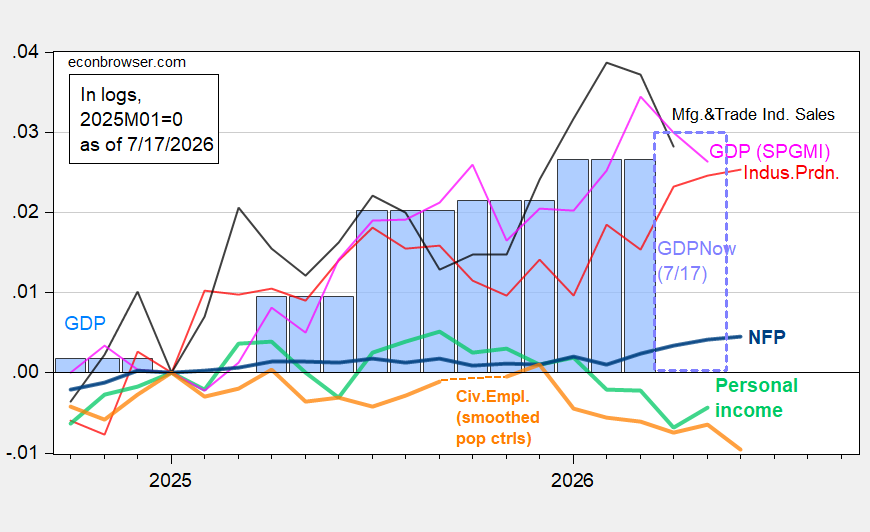
Industrial, Manufacturing Production and Business Cycle Indicators

Along with GDPNow. Industrial production under consensus (+0.1% m/m ov +0.2% Bloomberg consensus), while manufacturing is flat (+0.0%…

ByByNews on SantoshHub Jul 17, 2026

Leave a Reply

Your email address will not be published. Required fields are marked *

Scroll to Top