
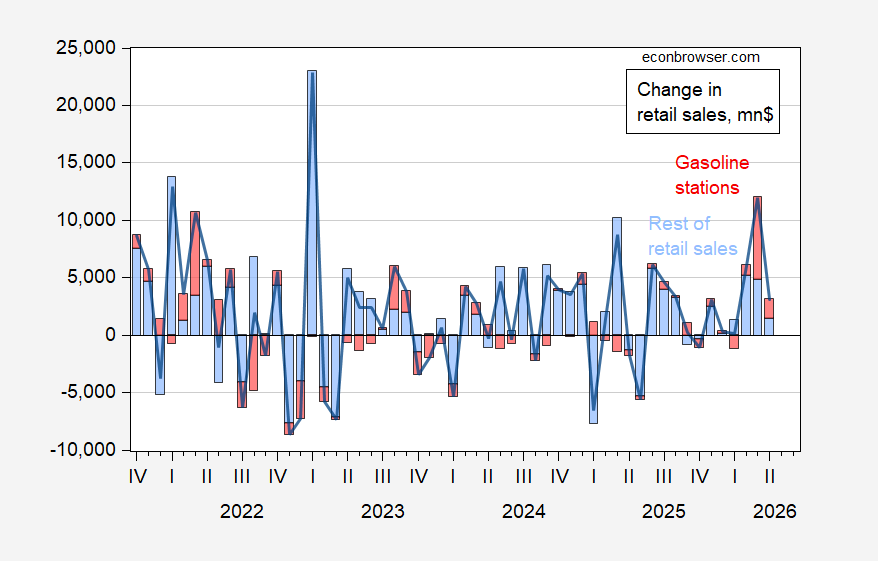

Sales rise, overall hits consensus. However, gasoline store sales constitute majority of increase.
Figure 1: Change in retail sales (black line), change in retail sales ex-gasoline stations (blue bar), change in retail sales from gasoline stations (red), all in millions $, s.a. Source: Census.
Most of the increase in retail sales in April is accounted for by sales from gasoline stations.
What has happened to retail sales ex-gasoline stations? Quantitatively, it depends on the deflator, but qualitatively, it’s a downward movement in April.
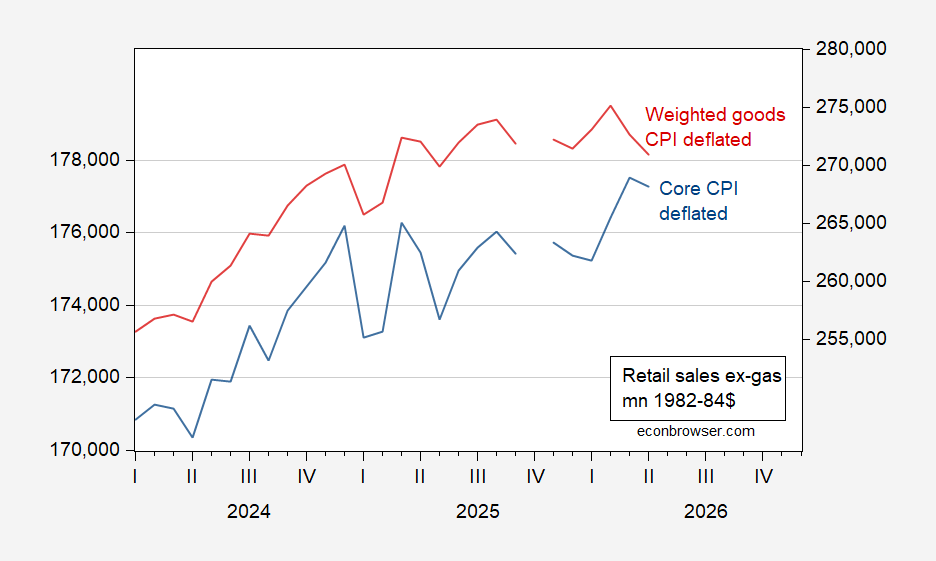
Figure 2: Retail sales ex-gasoline stations, deflated by core CPI (blue, left log scale), by weighted average of durables and nondurables (red, right log scale), both in mn 1982-84$, s.a. Goods CPI is geometric weighted average of durables (1/3), nondurables (2/3) prices. Source: Census, BLS, and author’s calculations.


 By
By