Headline, Core PPI above BLoomberg consensus (1.4% vs. 0.5% m/m; 1.0% vs. 0.3% m/m).
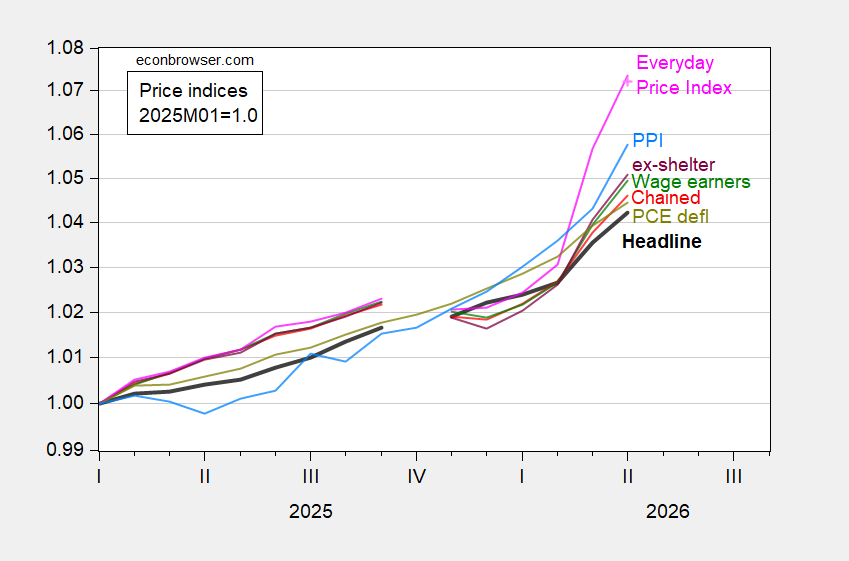
Figure 1: CPI-all urban (bold black), CPI wage earners and clerical (green), CPI ex-shelter (purple), CPI chained (red), PCE deflator (chartreuse), AIER Everday Price Index (pink), nowcasted AIER EPI (pink +), PPI (sky blue), all 2025M01=1.0, on log scale. Chained CPI is n.s.a. April PCE deflator is nowcasted as of 5/11. Source: BLS, BEA via FRED, AIER, Cleveland Fed, and author’s calculations.
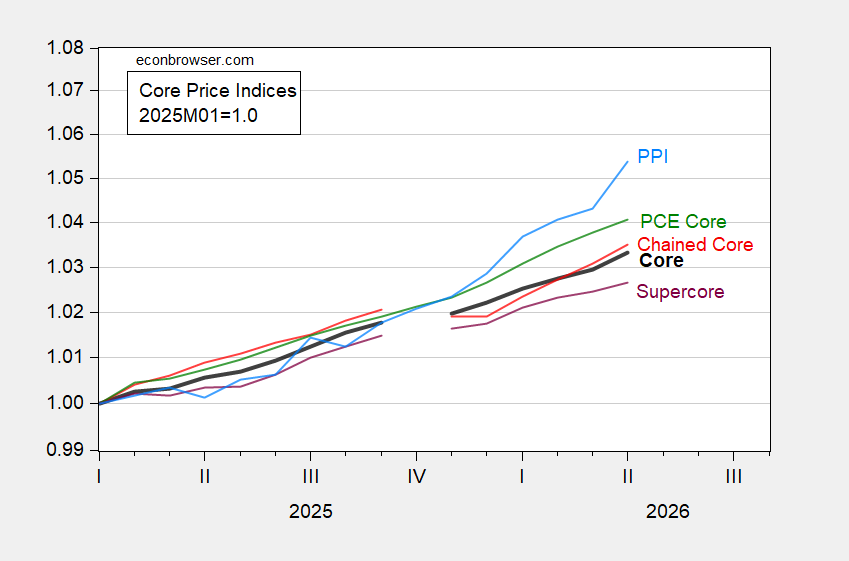
Figure 2: Core CPI-all urban (bold black), CPI chained core (red), CPI supercore (purple), PCE core deflator (green), core PPI (sky blue), all 2025M01=1.0, on log scale. Chained CPI is n.s.a. April PCE core is nowcasted as of 5/11. Source: BLS, BEA via FRED, BLS, Cleveland Fed, and author’s calculations.
Are there implications of PPI for CPI? A simple VAR using a Cholesky decomposition (PPI ordered first) indicates that there is a significant impact, at least over the 2022-2026M04 period:
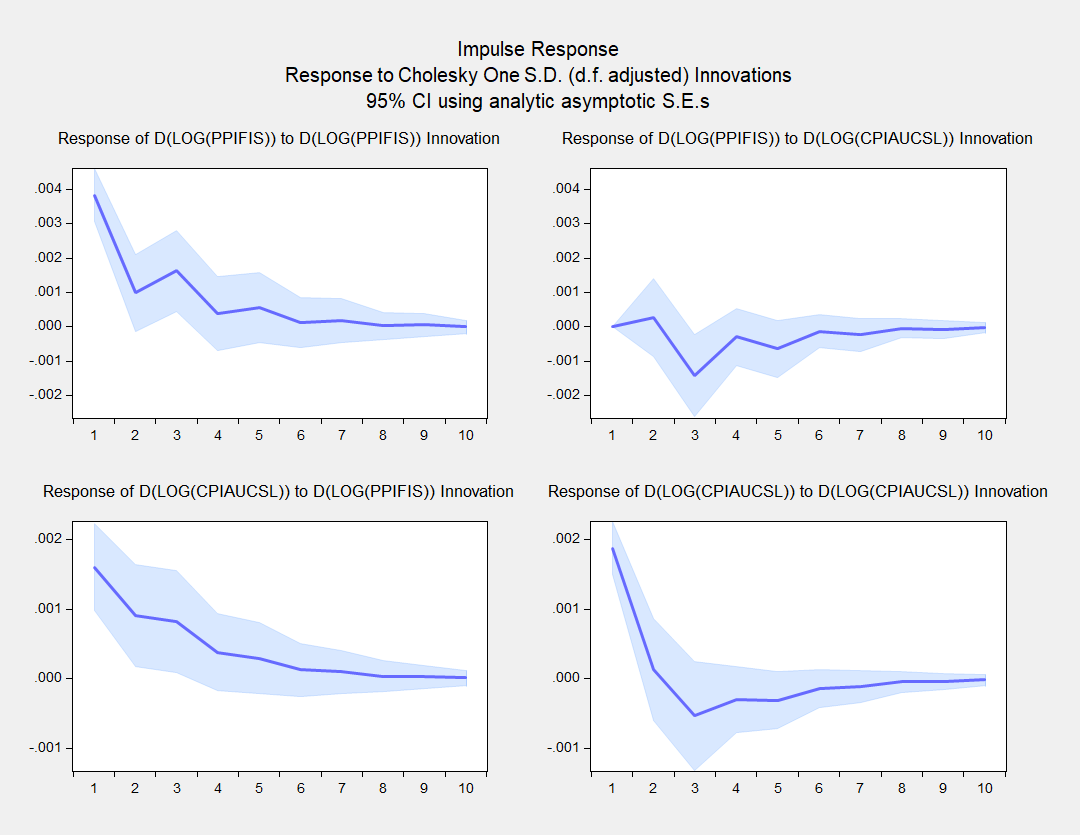
Figure 3: VAR Impulse Response Function with first log differences of PPI and CPI, 2022M01-2026M04. Cholesky decomposition, PPI ordered first.
The bottom left hand side IRF is the most important graph for our purposes. Over this sample period, a shock to PPI leads to an increase in CPI.
It’s true that the older literature Clark (1995) provides a more skeptical view that (legacy) PPI’s provide additional systematic predictive power. However, Caporale et al. (2002) used a more formal multivariate approach to conclude that for G-7 economies, PPI’s do lead CPI’s. Usingn the updated version of the PPI, Williams, (Empirical Economics, 2024) notes:
we identify several weighted disaggregated [PPI] series that unidirectionally influence or “cause” consumer price inflation providing valuable information for forecasters and policymakers. … we ascertain that three specific disaggregated producer price indices alone account for approximately two-thirds of the variation in consumer price inflation forecasts [over the 2012-2021 period]
These three categories are WPU05 (fuels and related products and power), WPU10 (metals and metal products) and WPU12 (furniture and household durables). Clearly, WPU05 has jumped.
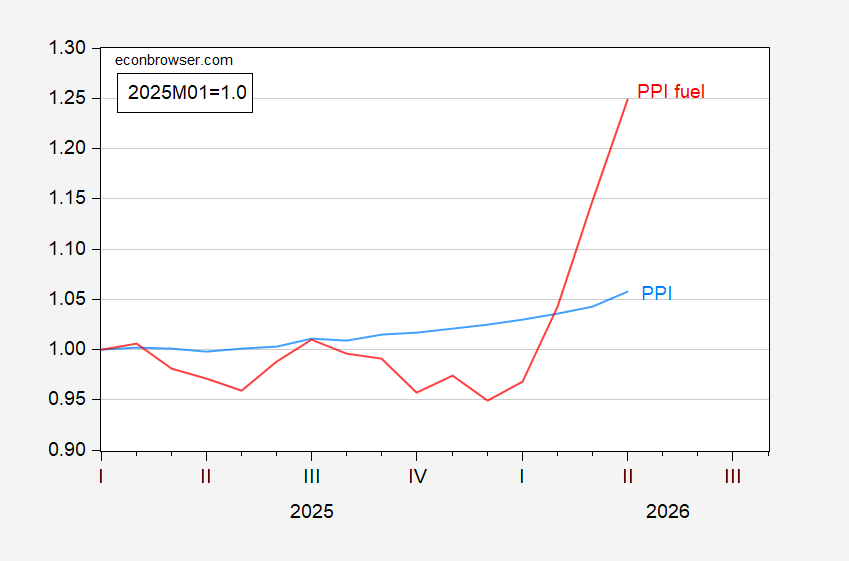
Figure 4: PPI (sky blue), PPI for fuels (red), both in 2025M01=1.0. Source: BLS and author’s calculations.
In a note today, Goldman Sachs concludes that the news regarding the PCE relevant items in the PPI did not necessitate a change in their tracking estimate for the PCE deflator, which is what the Fed follows most closely.
 By
By