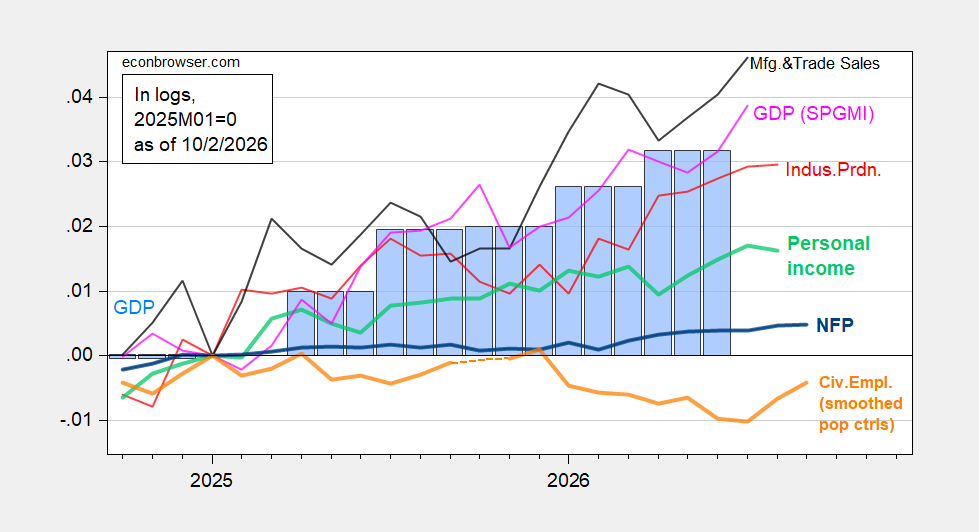

Employment downside surprise, +29K vs +89, with cumulative 81K downward revisions to previous two months. Taking into account early benchmark, it’s not changing the picture too much.
Figure 1: NFP employment (bold blue), civilian employment with smoothed population controls (bold orange), industrial production (red), personal income excluding current transfers in Ch.2017$ (bold light green), manufacturing and trade sales in Ch.2017$ (black), and monthly GDP in Ch.2017$ (pink), GDP (blue bars), all log normalized to 2025M01=0. Source: BLS via FRED, BLS, Federal Reserve, BEA 2026Q2 3rd release, S&P Global Market Insights (nee Macroeconomic Advisers, IHS Markit) (9/2/2026 release), and author’s calculations.
Note that employment from the household survey (CPS) continued to rise, but has not reattained January 2025 levels. This measure is subject to wider standard errors, but the trend is subject to less revision within the year (i.e., for same population controls).
Notice that the household employment series adjusted to the NFP concept (a research series) has much slower gradient, and it too remains below January 2025 levels. In addition, early benchmark — which incorporates QCEW data — is growing more slowly than reported NFP.
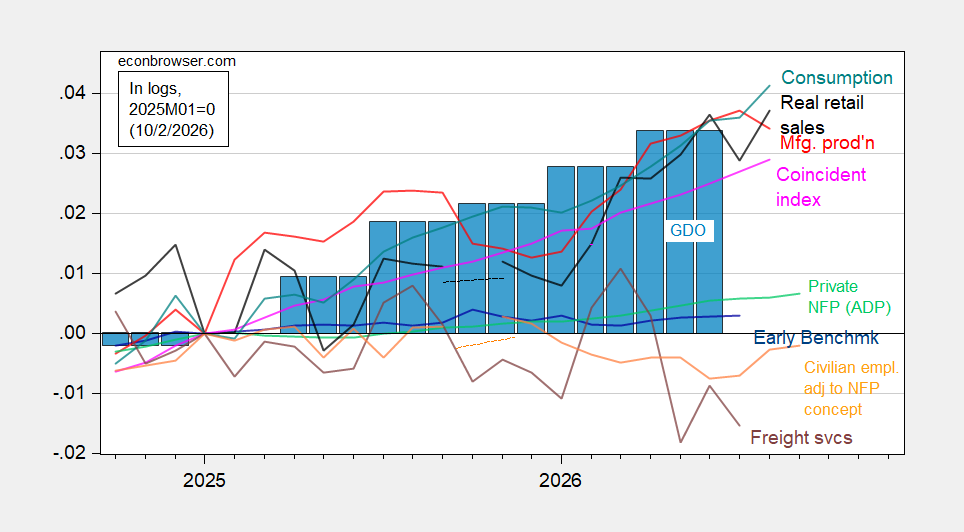
Figure 2: Civilian employment adjusted to NFP concept smoothed population controls, using experimental controls for 2025 (bold orange), manufacturing production (red), ADP private nonfarm payroll employment (light green), real retail sales, CPI deflated (black), freight services indexes (brown), and coincident index in Ch.2017$ (pink), GDO (blue bars), all log normalized to 2025M01=0. Source: BLS, ADP via FRED, Philadelphia Fed, Bureau of Transportation Statistics, Federal Reserve via FRED, BEA 2026Q2 3rd release, and author’s calculations.
Note that the freight services index has taken a dive relative to the last reading that went through May.
The picture of recent private NFP revisions looks like this:
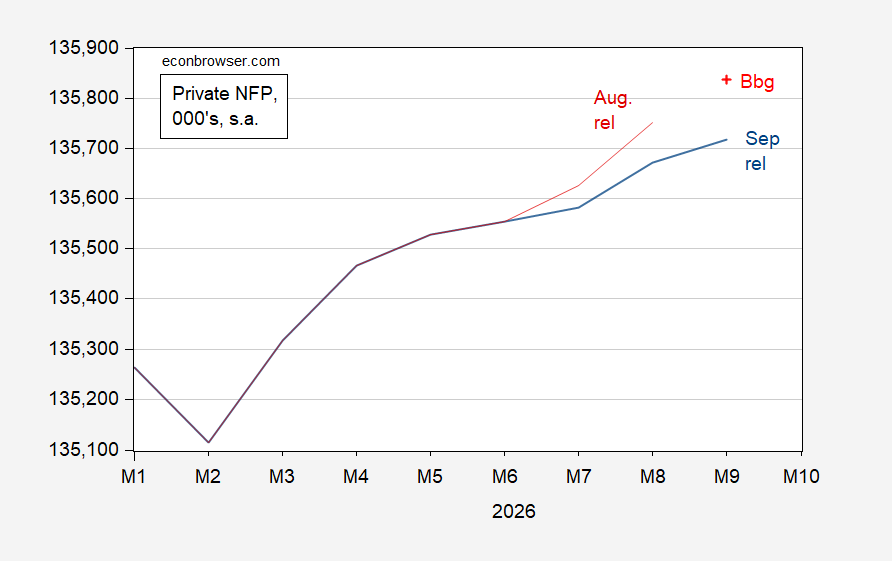
Figure 3: Private NFP from August release (red), from September release (blue), and implied Bloomberg consensus (red +), all in 000’s, s.a., on log scale. Source: BLS, Bloomberg, and author’s calculations.
+29 is still above some estimates of employment breakeven, per Torsten Slok, Ernie Tedeschi. and as recounted by AP via BNNBloomberg.


 By