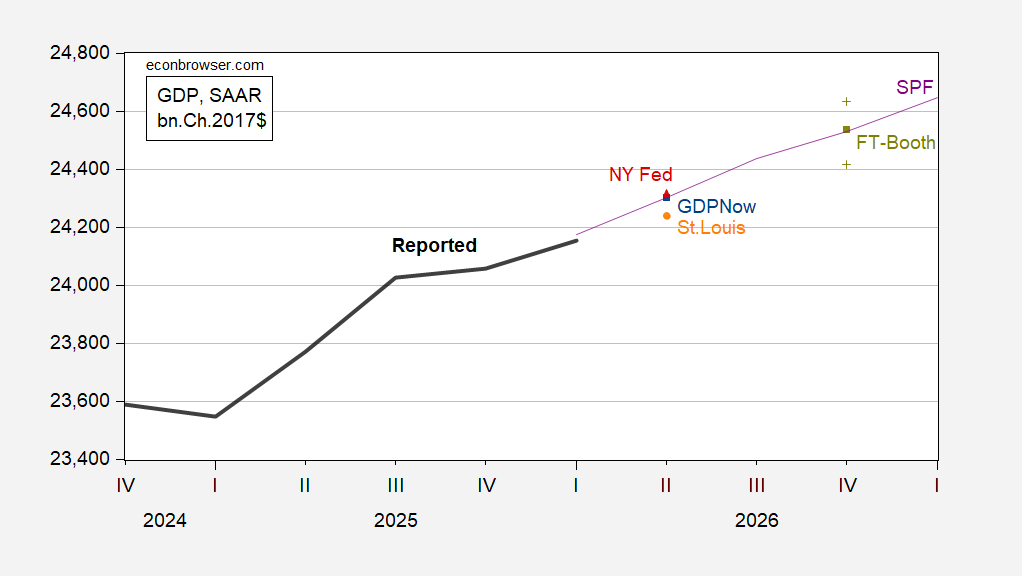

GDPNow updated downward:
Figure 1: GDP (bold black), GDPNow of 6/26 (blue square), St . Louis Fed news nowcast of 6/26 (orange circle), NY Fed nowcast (red triangle), May SPF (purple), June FT Booth survey (chartreuse), 10th/90th percentiles (chartreuse +), all in bn.Ch.2017$, SAAR. Source: BEA 2026Q1 3rd release, Atlanta Fed, NY Fed, St Louis Fed, Philadelphia Fed, FT-Booth survey, and author’s calculations.
There’s less dispersion in nowcasts and tracking forecasts. Goldman Sachs tracking of 6/26 is for 2.2%, just below GDPNow’s 2.5%.
For an indication of momentum, I turn to “core GDP” or final sales to private domestic purchasers. There’s been a downshift in level and growth rate there as well.
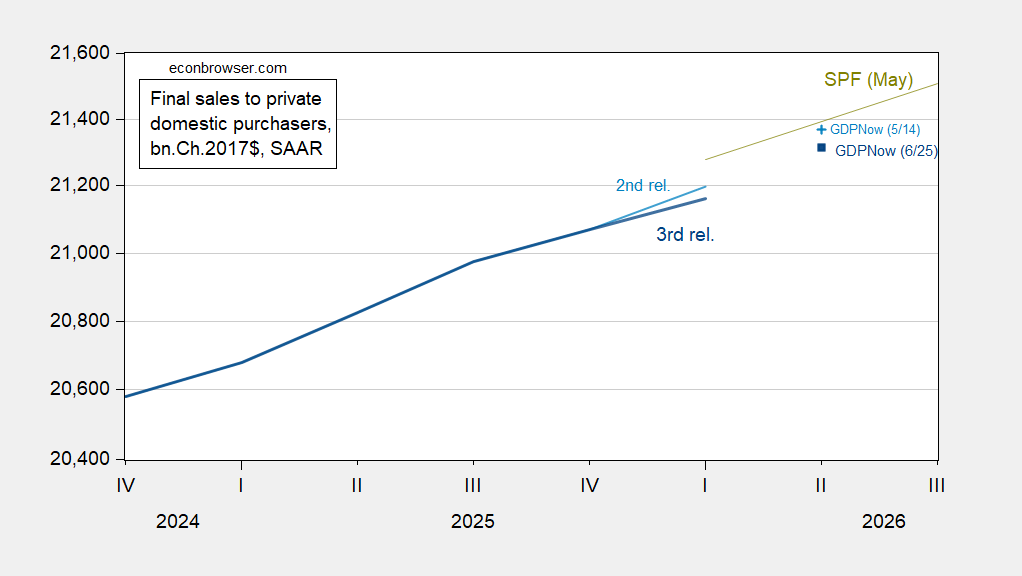
Figure 2: Final sales to private domestic purchasers in 2nd release (light blue), in 3rd relase (dark blue), GDPNow of 5/14 (light blue +), GDPow of 6/25 (dark blue square), May SPF (chartreuse line), all in bn.Ch.2017$ SAAR. Source: BEA, Atlanta Fed, Philadelphia Fed and author’s calculations.


 By
By