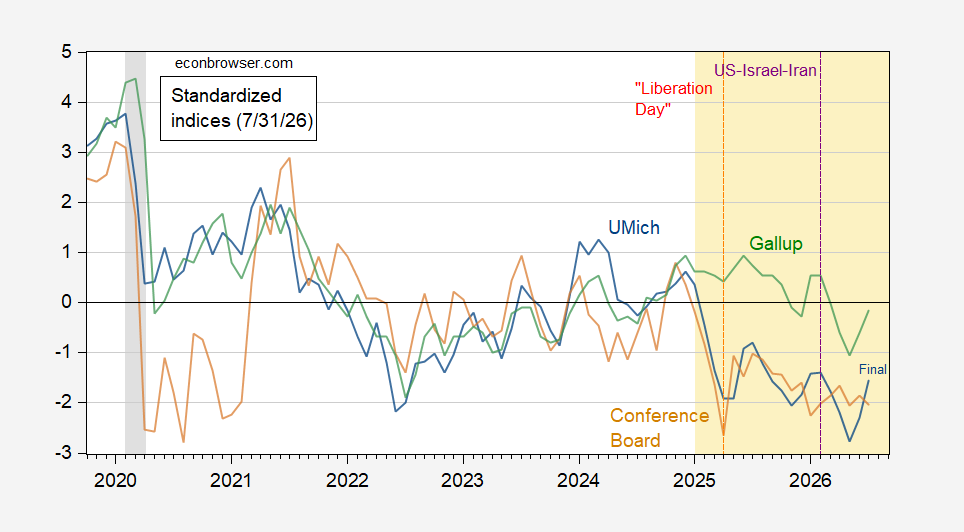

Michigan final sentiment and Conference Board confidence near pre War levels. But still 2.2 to 2.4 standard deviations below pre Trump. Gallup confidence 1.1 standard deviations below.
Figure 1: U.Michigan Economic Sentiment (blue), Conference Board Confidence Index (brown), Gallup Confidence level (green), all demeaned and divided by standard deviation 2021M01-2025m02. Orange dashed line at “Liberation Day”, purple dashed line at US Iran war start. Source: UMichigan, Gallup, Conference Board, and author’s calculations.
The rebound is — visually at least — seemingly driven by gas prices.
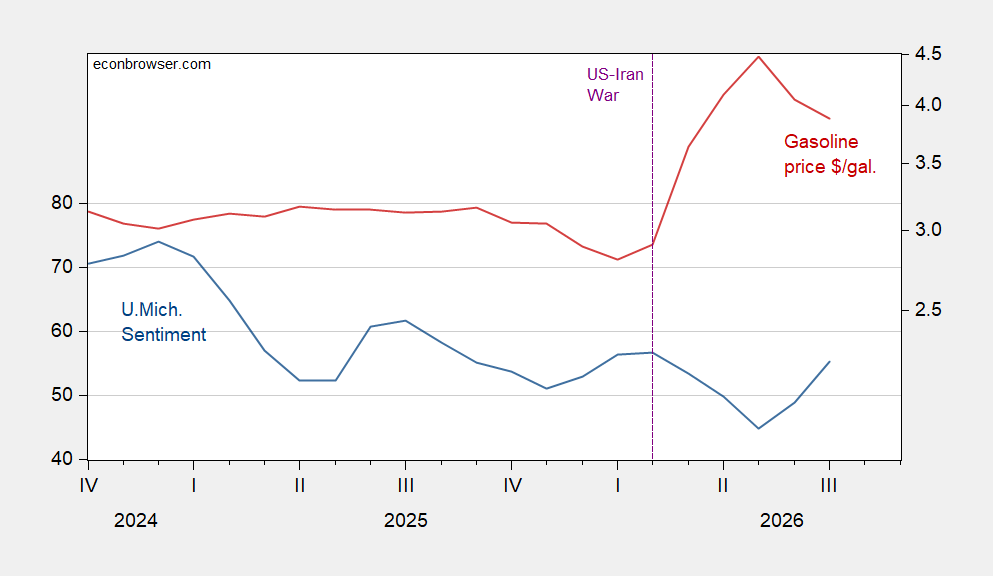
Figure 2: U.Michigan Consumer Sentiment (blue, left scale), price of gasoline, $/gallon (red, right log scale). Source: U.Michigan, EIA, and author’s calculations.


 By
By